Pulse Viewer
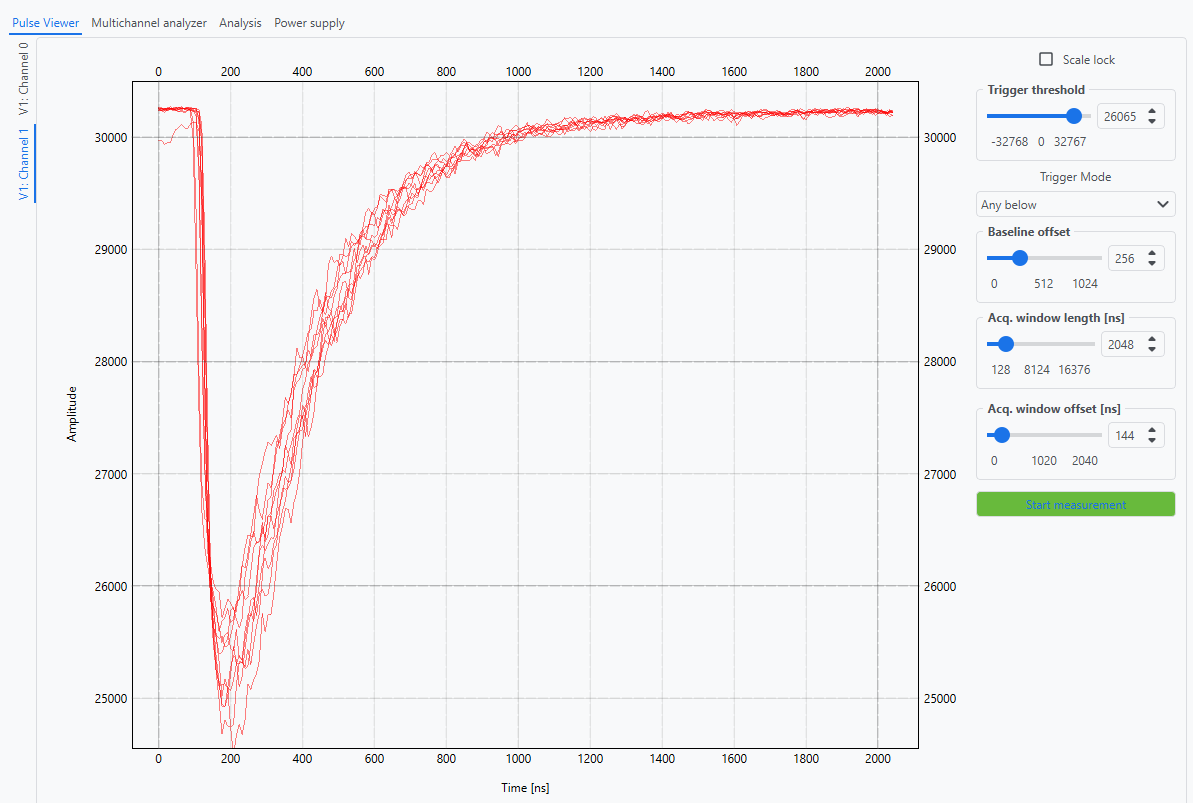
The Pulse Viewer allows you to display the waveforms of recorded pulses by the ADC converter. Thanks to this, it is possible to estimate the basic parameters of the pulses, such as polarity, pulse rise, and fall time.
The Pulse Viewer Tab
Waveforms viewed in the Pulse Viewer tab are decimated by 4. Full-timing resolution waveforms are grabbed in the Save streaming data option.
The Pulse Viewer settings
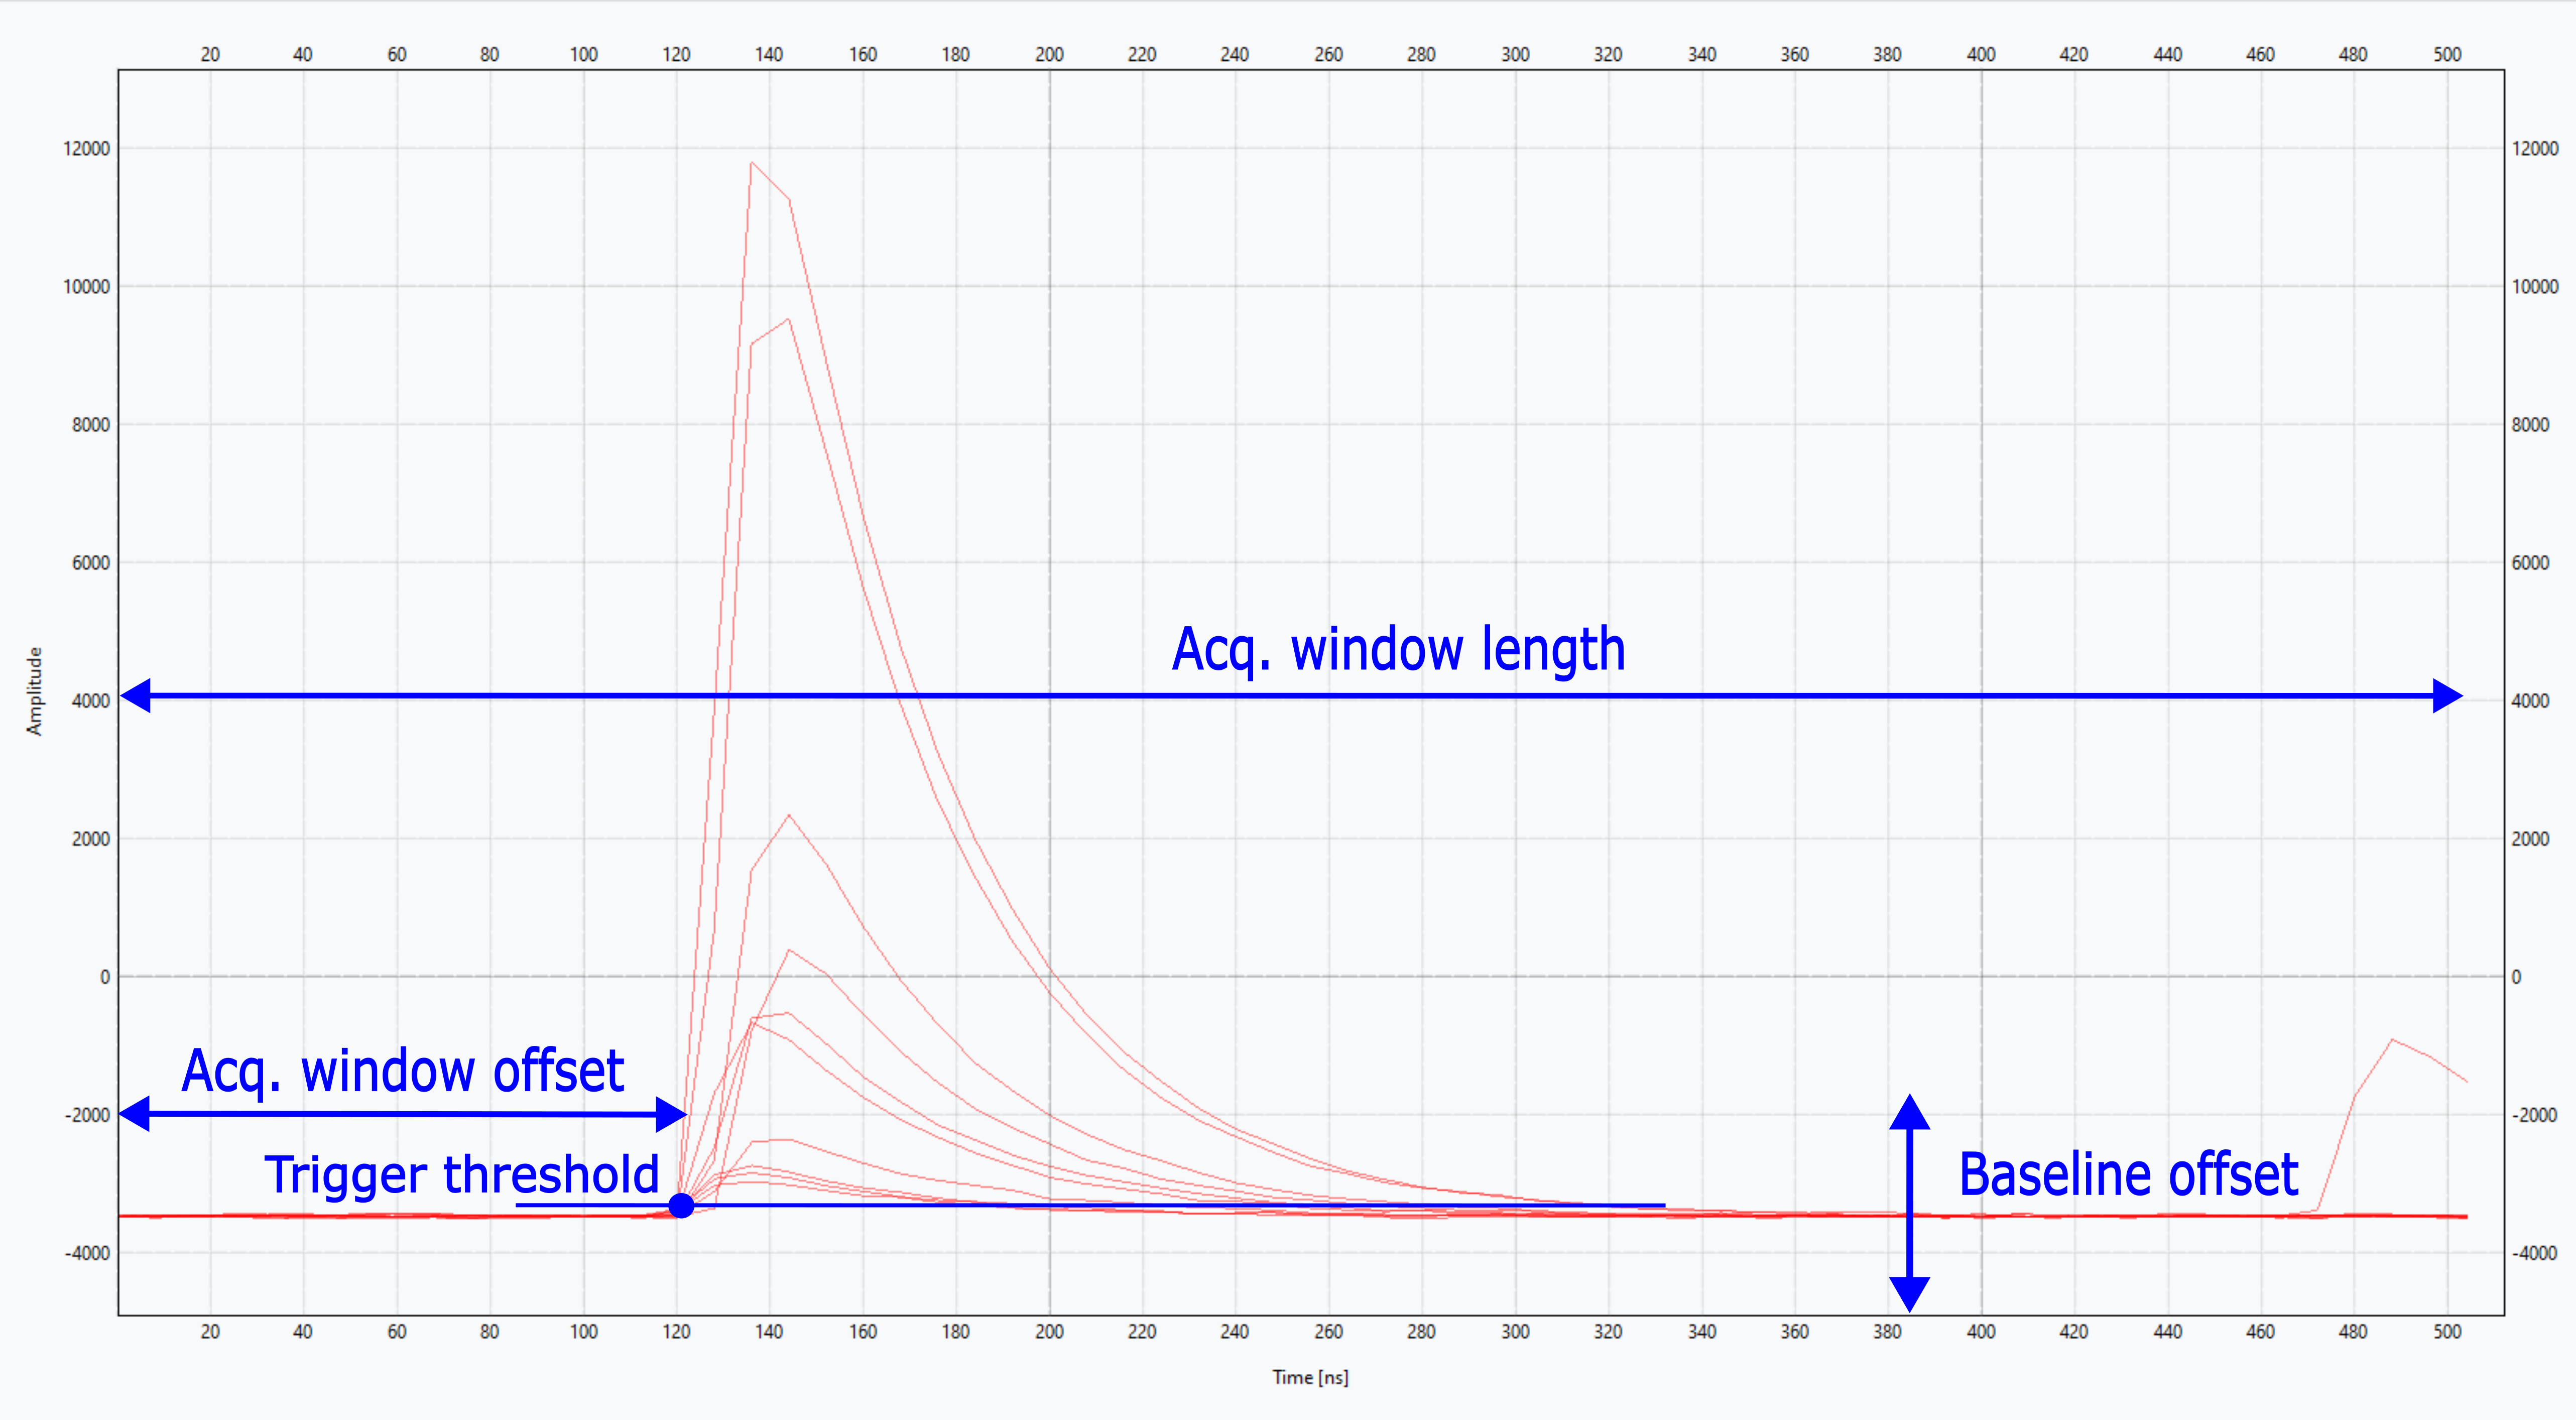
Trigger threshold
The value of trigger threshold is referenced to 0 level.
Note
When adjusting the trigger level of a digitizer the user should keep in mind that the digitized samples are represented in a range from -2^Nbit to (2^Nbit - 1) scale (when Nbit is the number of bit of the digitizer ADC) but the digitizer input dynamic range scale is not calibrated and cannot be used as a reference for absolute measurements like a standard oscilloscope but just for relative ones.
Acq. window length
Acquisition window length of the input signal.
Acq. window offset
Acquisition window offset allows you to adjust the signal position relative to the entire acquisition window.
Baseline offset
The DC baseline shift is implemented using a hardware DAC placed in the analog input path (analog front-end, AFE). Signals from detectors are mainly unipolar. Adjusting the DC baseline level will provide proper voltage range matching. The middle level is 512.
Note
Changing this parameter will change the DC baseline offset in the entire digital pulse processing path for selected channel.
Trigger Mode
Any above - Any sample is above the trigger threshold.
Any below - Any sample is above the trigger threshold.
Rising edge - First sample is below and second is above trigger threshold.
Falling edge - First sample is above and second is below trigger threshold.
Save streaming data
To save streaming data consisting of the viewed pulses, go to Options -> Data Stream Settings and set the file format and local storage location. To enable downloading streaming data from the next measurement, set the options Save streaming data.
Note
The ADC is of the time-interleaved type, which in this case means that it consists of two ADCs alternately sampling the same signal. Hardware interleaving correction is disabled in the ADC and, if necessary, must be digitally implemented by the user.
Code to read binary data using Python:
import os
import struct
import numpy as np


def read_waveforms(file_path: str, frame_length: int=None) -> np.ndarray:
    f_size = os.stat(file_path).st_size
    if frame_length is not None: # frame length is known
        fmt = f'{f_size//2}h'
        fmt_size = struct.calcsize(fmt)
    else: # unknown frame length, read whole data as one impulse
        fmt = f'{frame_length//2}h'  # h for int16
        fmt_size = struct.calcsize(fmt)
    waveforms = []
    position = 0
    # Open the binary file in binary mode
    with open(file_path, 'rb') as infile:
        while True:
            impulse = struct.unpack(fmt, infile.read(fmt_size))
            waveforms.append(impulse)
            position += fmt_size
            if position + fmt_size > f_size:
                break
    return np.array(waveforms)

if __name__ == "__main__":
    # usage

    filename = 'your_data.bin'

    data = read_waveforms(filename)
    # unknown frame length, returns a numpy array with the whole signal as one waveform

    data = read_waveforms(filename, frame_length=256)
    # known frame length, return a numpy array with waveforms in each row of the array